World bank health data

library(data.table)
library(tidyverse)
Data has been downloaded and is called data.csv. https://www.kaggle.com/theworldbank/health-nutrition-and-population-statistics/data
data <- fread('~/Downloads/data.csv', fill=T, stringsAsFactors=F)
dim(data)
## [1] 89010 61head(data)## Country Name Country Code
## 1: Arab World ARB
## 2: Arab World ARB
## 3: Arab World ARB
## 4: Arab World ARB
## 5: Arab World ARB
## 6: Arab World ARB
## Indicator Name
## 1: % of females ages 15-49 having comprehensive correct knowledge about HIV (2 prevent ways and reject 3 misconceptions)
## 2: % of males ages 15-49 having comprehensive correct knowledge about HIV (2 prevent ways and reject 3 misconceptions)
## 3: Adolescent fertility rate (births per 1,000 women ages 15-19)
## 4: Adults (ages 15+) and children (0-14 years) living with HIV
## 5: Adults (ages 15+) and children (ages 0-14) newly infected with HIV
## 6: Adults (ages 15+) living with HIV
## Indicator Code 1960 1961 1962
## 1: SH.HIV.KNOW.FE.ZS
## 2: SH.HIV.KNOW.MA.ZS
## 3: SP.ADO.TFRT 133.55501327769 134.159118941963 134.857912280869
## 4: SH.HIV.TOTL
## 5: SH.HIV.INCD.TL
## 6: SH.DYN.AIDS
## 1963 1964 1965 1966
## 1:
## 2:
## 3: 134.504575565342 134.105211273476 133.56962589645 132.675635192775
## 4:
## 5:
## 6:
## 1967 1968 1969 1970
## 1:
## 2:
## 3: 131.665502129354 129.190980115918 126.736756382819 124.382808900193
## 4:
## 5:
## 6:
## 1971 1972 1973 1974
## 1:
## 2:
## 3: 122.133431342027 120.020185557559 118.087531093609 116.132988067096
## 4:
## 5:
## 6:
## 1975 1976 1977 1978
## 1:
## 2:
## 3: 114.100918174437 111.980005447216 109.783821762662 106.033489239906
## 4:
## 5:
## 6:
## 1979 1980 1981 1982
## 1:
## 2:
## 3: 102.341720681455 98.7390023274647 95.2412508672802 91.7911923993221
## 4:
## 5:
## 6:
## 1983 1984 1985 1986
## 1:
## 2:
## 3: 88.0011769487606 84.2072557839419 80.3593225600132 76.4415956498419
## 4:
## 5:
## 6:
## 1987 1988 1989 1990
## 1:
## 2:
## 3: 72.5145803648751 71.1706639452677 69.8887679924858 69.0044133814268
## 4:
## 5:
## 6:
## 1991 1992 1993 1994
## 1:
## 2:
## 3: 67.7559924352118 66.9284506867798 64.9489678572737 62.9227777228154
## 4:
## 5:
## 6:
## 1995 1996 1997 1998
## 1:
## 2:
## 3: 60.7070695260477 58.5966308804751 56.4401276304142 55.5315395528949
## 4:
## 5:
## 6:
## 1999 2000 2001 2002
## 1:
## 2:
## 3: 54.6587808352011 53.8314102398679 52.9015276443892 51.9907926813042
## 4:
## 5:
## 6:
## 2003 2004 2005 2006
## 1:
## 2:
## 3: 51.5228563035101 51.1032496482833 50.7325902239383 50.3291352282938
## 4:
## 5:
## 6:
## 2007 2008 2009 2010
## 1:
## 2:
## 3: 49.9998514069402 49.8870459355469 49.7812066054555 49.6729747116906
## 4:
## 5:
## 6:
## 2011 2012 2013 2014
## 1:
## 2:
## 3: 49.5360469363113 49.3837446924523 48.7965576984378 48.1964180547578
## 4:
## 5:
## 6:
## 2015 V61
## 1: NA
## 2: NA
## 3: NA
## 4: NA
## 5: NA
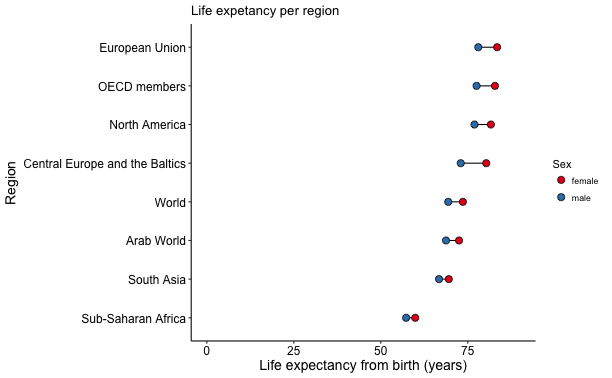
## 6: NAcolnames(data) <- gsub(" ", "_", colnames(data))Dataset consists of countries and larger regions. First I want to investigate the differences in life expectancy per region.
We see that different regions have different life expectancy for both female and male. The survival of men is always lower comapred to females.
regions <- data[data$Country_Name %in% unique(data$Country_Name)[1:41],]
regions2014 <- regions[,c(1:4, 59)]
regions2014 %>%
    filter(Indicator_Name == "Life expectancy at birth, female (years)" |
        Indicator_Name == "Life expectancy at birth, male (years)" ) %>%
    melt(id=c(1:4)) %>%
    mutate(Sex = gsub("Life expectancy at birth, |\\(years\\)", "", Indicator_Name)) %>%
    arrange(value) %>%
    filter(!grepl('income|&|dividend|small|Small|area|UN|conflict|poor', Country_Name)) %>%
    mutate(Country_Name = factor(Country_Name, levels=unique(Country_Name))) %>%
    ggplot(aes(x = Country_Name, y = as.numeric(value), fill=Sex, group=Country_Name)) +
        coord_flip()+
        ylim(0,90)+
        #geom_segment(aes(x = 0, x = Country_Name, xend = value), color = "grey50") +
        geom_line() +
    	geom_point(pch=21, size=3) +
        scale_fill_brewer(palette="Set1") +
    	#scale_fill_manual(values=c('deepskyblue','darkorange2')) +
    	theme_classic() +
    	theme( axis.title.x = element_text(size=14), axis.text.x = element_text(size=12,colour='black'),
            axis.text.y = element_text(size=12,colour='black'), axis.title.y = element_text(size=14))+
    	ggtitle('Life expetancy per region') +
    	xlab('Region') +
        ylab('Life expectancy from birth (years)')