gganatogram
gganatogram
https://github.com/jespermaag/gganatogram
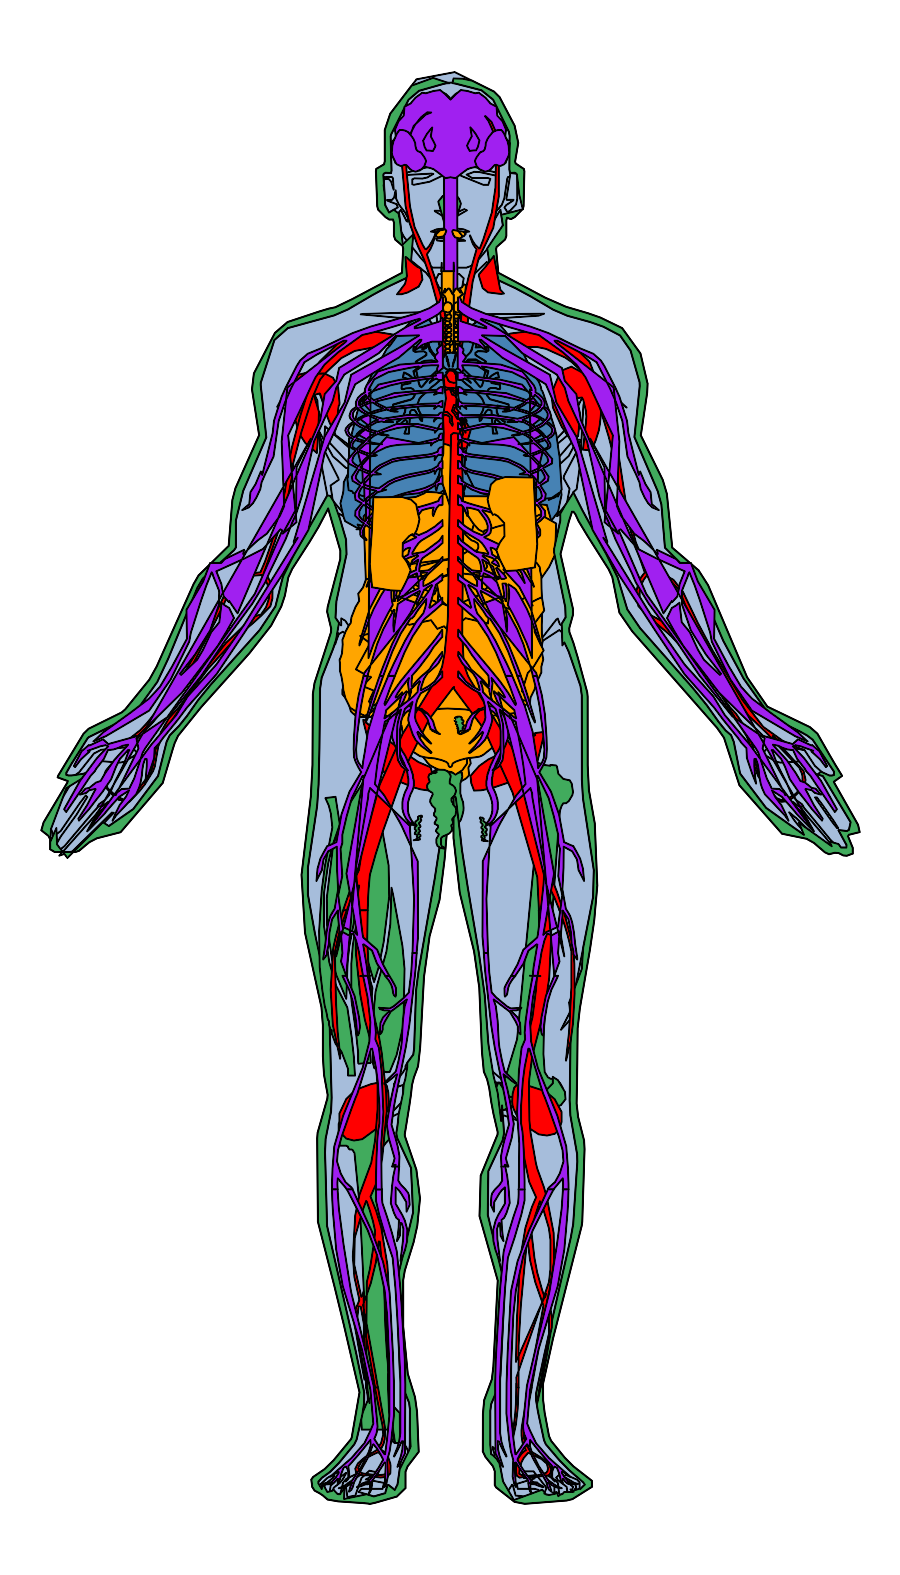
Create anatogram images for different organisms.
For now only human male is available.
.
The idea for this package came to me after seeing a twitter post for ggseg.
I thougt something similar would be good for whole organisms.
Since I could not find anything similar, I deided to give creating my first R package a go.
This package uses the tissue coordinates from the figure in ArrayExpress Expression Atlas.
https://www.ebi.ac.uk/gxa/home
https://github.com/ebi-gene-expression-group/anatomogram
Generation of package
Download all svg
To create the package, I first had to retrive the coordinates of all tissues from the Expression Atlas. The anatogram package was downloaded using the following command.
npm install --save anatomogram
Extract coordinates from svg
I used python to extract the coordinates, names, and transformations for each tissue in the homo_sapiens.mal.svg file. This code takes the svg and writes the name, coordinates, and transformation to a file, which is then processed in R.
from xml.dom import minidom
import os
import csv
organism="homo_sapiens.male"
doc = minidom.parse(organism + ".svg")
your_csv_file = open(organism + '_coords.tsv', 'w')
wr = csv.writer(your_csv_file, delimiter='\t')
for path in doc.getElementsByTagName('path'):
    if "outline" in path.getAttribute('id') or "LAYER_OUTLINE" in path.getAttribute('id') :
        wr.writerow([path.getAttribute('id') ,path.getAttribute('d'), str('matrix(1,0,0,1,0,0)')])
    if path.getAttribute('id').startswith('UB'):
        wr.writerow([path.getElementsByTagName('title')[0].firstChild.nodeValue, path.getAttribute('d'), str('matrix(1,0,0,1,0,0)')])
    if path.parentNode.attributes['id'].value.startswith('UB'):
        if "transform" not in list(path.parentNode.attributes.keys()):
            wr.writerow([path.parentNode.attributes['id'].value, path.getAttribute('d'), str('matrix(1,0,0,1,0,0)')])
for path in doc.getElementsByTagName('g')[5:]:
    if len(path.childNodes) >0 :
        for node in path.childNodes:
            if "text" not in node.nodeName:
                print(node.nodeName)
                print(node.attributes.keys())
                if 'd' in list(node.attributes.keys()):
                    nodeVal = node.attributes['d'].value
                    wr.writerow([path.childNodes[1].attributes['id'].value, nodeVal,  path.attributes['transform'].value])
your_csv_file.close()
Process the coordinates in R, and create a package
I created a function to extract the coordinates into a data frame and transformed the data. Some manual editing was required to get the right coordinates, and remove some tissues that did not work
extractCoords <- function(coords, name, transMatrix) {
    c <- strsplit(coords, " ")
    c[[1]]

    c[[1]][c(grep("M", c[[1]] )+1,grep("M", c[[1]] )+2)] <- NA

    c[[1]] <- c[[1]][grep("[[:alpha:]]", c[[1]], invert=TRUE)]

    anatCoord <- as.data.frame(lapply( c, function(u)
        matrix(as.numeric(unlist(strsplit(u, ","))),ncol=2,byrow=TRUE) ))
    anatCoord$X2[is.na(anatCoord$X1)] <- NA
    anatCoord$X1[is.na(anatCoord$X2)] <- NA
    anatCoord$id <- name

    if (length(transMatrix[grep('matrix', transMatrix)])>0) {
        transForm <- gsub('matrix\\(|\\)', '', transMatrix)
        transForm <- as.numeric(strsplit(transForm, ",")[[1]])

        anatCoord$x <-  (anatCoord$X1* transForm[1]) + (anatCoord$X1* transForm[3]) + transForm[5]
        anatCoord$y <-  (anatCoord$X2* transForm[2]) + (anatCoord$X2* transForm[4]) + transForm[6]
    } else if (grep('translate', transMatrix)) {
        transForm <- gsub('translate\\(|\\)', '', transMatrix)
        transForm <- as.numeric(strsplit(transForm, ",")[[1]])
         if(name =='leukocyte' & transForm[1]==4.5230265) {
            transForm <- c(103.63591+4.5230265,-47.577078+11.586659)
        }
        anatCoord$x <-  anatCoord$X1 + transForm[1]
        anatCoord$y <-  anatCoord$X2 + transForm[2]
    }
    #anatCoord <- anatCoord[complete.cases(anatCoord),]
    if (name == 'bronchus') {
        if (max(anatCoord$x, na.rm=T) >100 ) {
            anatCoord$x <- NA
            anatCoord$y <- NA
        }
    }
    if( any(anatCoord[complete.cases(anatCoord),]$x < -5)) {
            anatCoord$x <- NA
            anatCoord$y <- NA
    }

    if( any(anatCoord[complete.cases(anatCoord),]$x > 150)) {
            anatCoord$x <- NA
            anatCoord$y <- NA
    }
    return(anatCoord)
}
Finally, I processed the python output using the extractCoords function.
hsMale <- read.table('homo_sapiens.male_coords.tsv', sep='\t', stringsAsFactors=F)

hgMale_list <- list()
for (i in 1:nrow(hsMale)) {
    df <- extractCoords(hsMale$V2[i], hsMale$V1[i],  hsMale$V3[i])

    hgMale_list[[i]] <- extractCoords(hsMale$V2[i], hsMale$V1[i],  hsMale$V3[i])
    names(hgMale_list)[i] <-  paste0(hsMale$V1[i],'-', i)
}
names(hgMale_list) <- gsub('-.*', '', names(hgMale_list))
The resulting list was then used as the base for the gganatogram package. The package can be installed from github using the instructions below.
Install
Install from github using devtools.
## install from Github
devtools::install_github("jespermaag/gganatogram")
Usage
This package requires ggplot2 and ggpolypath
library(ggplot2)
library(ggpolypath)
library(gganatogram)
library(dplyr)
In order to use the function gganatogram, you need to have a data frame with organ, colour, and value if you want to.
organPlot <- data.frame(organ = c("heart", "leukocyte", "nerve", "brain", "liver", "stomach", "colon"),
 type = c("circulation", "circulation",  "nervous system", "nervous system", "digestion", "digestion", "digestion"),
 colour = c("red", "red", "purple", "purple", "orange", "orange", "orange"),
 value = c(10, 5, 1, 8, 2, 5, 5),
 stringsAsFactors=F)

head(organPlot)
## organ type colour value
## 1 heart circulation red 10
## 2 leukocyte circulation red 5
## 3 nerve nervous system purple 1
## 4 brain nervous system purple 8
## 5 liver digestion orange 2
## 6 stomach digestion orange 5Using the function gganatogram with the filling the organs based on colour.
gganatogram(data=organPlot, fillOutline='#a6bddb', organism='human', sex='male', fill="colour")
We can use the ggplot themes and functions to adjust the plots
gganatogram(data=organPlot, fillOutline='#a6bddb', organism='human', sex='male', fill="colour") +
theme_void()
We can also plot all tissues available using hgMale_key, which is an available object
hgMale_key$organ## [1] "bone marrow" "frontal cortex"
## [3] "prefrontal cortex" "gastroesophageal junction"
## [5] "caecum" "ileum"
## [7] "rectum" "nose"
## [9] "tongue" "penis"
## [11] "nasal pharynx" "spinal cord"
## [13] "throat" "diaphragm"
## [15] "liver" "stomach"
## [17] "spleen" "duodenum"
## [19] "gall bladder" "pancreas"
## [21] "colon" "small intestine"
## [23] "appendix" "urinary bladder"
## [25] "bone" "cartilage"
## [27] "esophagus" "skin"
## [29] "brain" "heart"
## [31] "lymph_node" "skeletal_muscle"
## [33] "leukocyte" "temporal_lobe"
## [35] "atrial_appendage" "coronary_artery"
## [37] "hippocampus" "vas_deferens"
## [39] "seminal_vesicle" "epididymis"
## [41] "tonsil" "lung"
## [43] "trachea" "bronchus"
## [45] "nerve" "kidney"gganatogram(data=hgMale_key, fillOutline='#a6bddb', organism='human', sex='male', fill="colour") +theme_void()
To skip the outline of the graph, use outline=F
organPlot %>%
    dplyr::filter(type %in% c('circulation', 'nervous system')) %>%
gganatogram(outline=F, fillOutline='#a6bddb', organism='human', sex='male', fill="colour") +
theme_void()
We can fill the tissues based on the values given to each organ
gganatogram(data=organPlot, fillOutline='#a6bddb', organism='human', sex='male', fill="value") +
theme_void() +
scale_fill_gradient(low = "white", high = "red")
We can also use facet_wrap to compare groups.
First create add two data frames together with different values and the conditions in the type column
compareGroups <- rbind(data.frame(organ = c("heart", "leukocyte", "nerve", "brain", "liver", "stomach", "colon"),
  colour = c("red", "red", "purple", "purple", "orange", "orange", "orange"),
 value = c(10, 5, 1, 8, 2, 5, 5),
 type = rep('Normal', 7),
 stringsAsFactors=F),
 data.frame(organ = c("heart", "leukocyte", "nerve", "brain", "liver", "stomach", "colon"),
  colour = c("red", "red", "purple", "purple", "orange", "orange", "orange"),
 value = c(5, 5, 10, 8, 2, 5, 5),
 type = rep('Cancer', 7),
stringsAsFactors=F))gganatogram(data=compareGroups, fillOutline='#a6bddb', organism='human', sex='male', fill="value") +
theme_void() +
facet_wrap(~type) +
scale_fill_gradient(low = "white", high = "red") 
gganatogram(data=hgMale_key, fillOutline='#a6bddb', organism='human', sex='male', fill="colour") +
    theme_void() +
    facet_wrap(~type)
gganatogram(data=hgMale_key, outline=F, fillOutline='#a6bddb', organism='human', sex='male', fill="colour") +
    theme_void() +
    facet_wrap(~type, scale='free')
organtype <- organPlot
organtype %>%
    mutate(type=organ) %>%
    gganatogram( outline=F, fillOutline='#a6bddb', organism='human', sex='male', fill="colour") +
        theme_void() +
        facet_wrap(~type, scale='free')